
Masterchart-View
The unique Masterchart-View combines the multiple alternative Elliot-Wave counts of different timeframes in one chart. This can bring a very big advantage, since all is at one place.
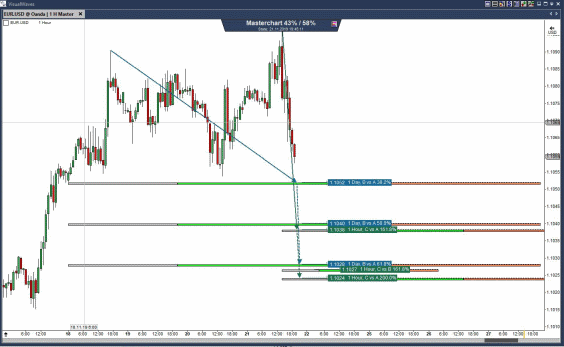
Simply select the wave fibos, resistance lines or price-labels to generate a full overview of whats going on at the market.
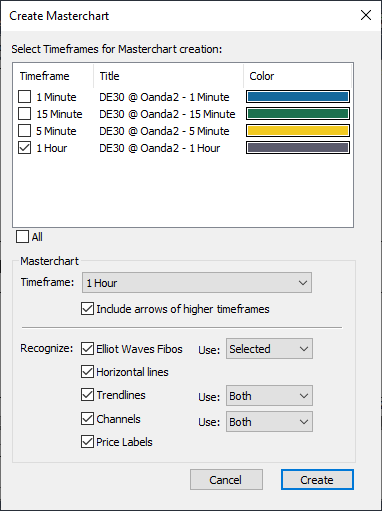
Choose what to show. Select the included timeframes and draw objects.